Note
Click here to download the full example code
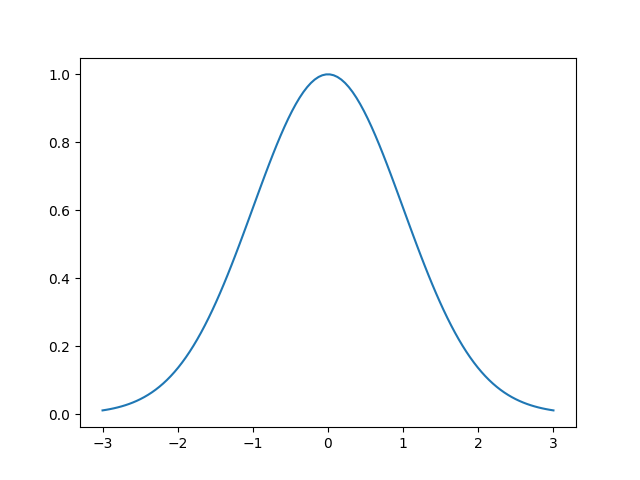
Plotting a gaussian (script)
Example matplotlib to plot a gaussian.
8 9 10 11 12 13 14 15 16 17 18 19 20 21 22 23 24 25 26 27 28 29 30 31 32 33 34 35 36 | # Libraries
import numpy as np
import matplotlib.pyplot as plt
# ---------------------------
# Methods
# ---------------------------
def gaussian(x, mu=0, sig=1):
return np.exp(-np.power(x - mu, 2.) / (2 * np.power(sig, 2.)))
# ---------------------------
# Configuration
# ---------------------------
# ---------------------------
# Main
# ---------------------------
# Load data
x = np.linspace(-3, 3, 120)
y = gaussian(x)
# Plot
plt.plot(x, y)
# Show
plt.show()
|
Total running time of the script: ( 0 minutes 0.308 seconds)