Note
Click here to download the full example code
Matching SQI Dataframe Window to Clinical Time of Shock
Matching SQI Dataframe Window to Clinical Time of Shock
Importing Libraries
10 11 12 13 14 15 16 17 18 19 20 | from datetime import date
import pandas as pd
import numpy as np
from datetime import datetime
import matplotlib.pyplot as plt
# We could use the below for simplicity but since we are going to be calculating these dataframes for multiple patients,
# then using a csv reader might be more efficient for large scale? Coule we append on axis = 0 multiple dataframes isntead? We would still
# need to read from CSV so that we only carry out once the calculations.
#from plot_SQI_pandas import Signal_SQIs as sqis
|
Loading SQI Data and clinical data
25 26 27 28 29 30 31 32 33 34 35 36 37 38 39 40 41 | '''
With some string manipulation and a loop we will be able to apply the following pipeline automatically,
depends on how we structure our SQIs i.e. separate dataframes or one large dataframe?
For now let's do it for a single file.
'''
filename_SQIs = r'..\..\..\..\OUCRU\01NVa_Dengue\Adults\01NVa-003-2001\SQI.csv'
filename_Clinical = r'..\..\..\..\OUCRU\Clinical\v0.0.10\01nva_data_stacked_corrected.csv'
#reading .csv into dataframes
Clinical = pd.read_csv(filename_Clinical)
SQIs = pd.read_csv(filename_SQIs)
#Showing Data
print(Clinical)
print(SQIs)
|
Out:
       Unnamed: 0  study_no                 date        column         result unit result_old  date_old
0               0  003-1001  2020-06-11 13:30:00  hypertension           True  NaN        NaN       NaN
1               1  003-1002  2020-06-17 11:10:00  hypertension          False  NaN        NaN       NaN
2               2  003-1003  2020-06-18 07:30:00  hypertension          False  NaN        NaN       NaN
3               3  003-1004  2020-06-22 12:45:00  hypertension          False  NaN        NaN       NaN
4               4  003-1005  2020-07-02 15:11:00  hypertension          False  NaN        NaN       NaN
...           ...       ...                  ...           ...            ...  ...        ...       ...
42060       42060  003-2231  2020-12-05 00:00:00       outcome  Full recovery  NaN        NaN       NaN
42061       42061  003-2232  2020-12-19 00:00:00       outcome  Full recovery  NaN        NaN       NaN
42062       42062  003-2233  2021-01-02 00:00:00       outcome  Full recovery  NaN        NaN       NaN
42063       42063  003-2234  2021-01-08 00:00:00       outcome  Full recovery  NaN        NaN       NaN
42064       42064  003-2235  2021-01-18 00:00:00       outcome  Full recovery  NaN        NaN       NaN

[42065 rows x 8 columns]
                   timedelta    first     last    skew_0  entropy_0  ...     msq_1  perfusion_1                                      correlogram_1     w  study_no
0     0 days 00:05:00.010000    30001    33000  0.011563   7.889833  ...  0.000323     6.674922  [75, 150, 225, 0.9087943183455219, 0.789911832...     0  003-2001
1     0 days 00:05:30.010000    33001    36000 -0.132401   7.869577  ...  0.000013     5.596514  [74, 148, 222, 0.9181757635079706, 0.827234373...     1  003-2001
2     0 days 00:06:00.010000    36001    39000 -0.124814   7.857955  ...  0.000008     6.091551  [75, 150, 224, 0.9094662436276878, 0.775536874...     2  003-2001
3     0 days 00:06:30.010000    39001    42000  0.087626   7.863540  ...  0.000021     4.305403  [75, 150, 225, 0.9134459565030647, 0.822742844...     3  003-2001
4     0 days 00:07:00.010000    42001    45000 -0.058097   7.855827  ...  0.000000     4.244410  [74, 149, 223, 0.913985197557938, 0.7969092381...     4  003-2001
...                      ...      ...      ...       ...        ...  ...       ...          ...                                                ...   ...       ...
1851  0 days 15:30:30.010000  5583001  5586000  0.144338   7.847808  ...  0.000008     4.864304  [31, 74, 105, -0.38335045092285824, 0.93538125...  1851  003-2001
1852  0 days 15:31:00.010000  5586001  5589000  0.128500   7.874039  ...  0.000008     4.277679  [76, 151, 226, 0.9362344077635872, 0.847005080...  1852  003-2001
1853  0 days 15:31:30.010000  5589001  5592000 -0.003407   7.861910  ...  0.000004     4.790734  [76, 152, 228, 0.9537593069974436, 0.889395196...  1853  003-2001
1854  0 days 15:32:00.010000  5592001  5595000  0.113608   7.865455  ...  0.000004     4.068148  [74, 149, 223, 0.9298975484283258, 0.810992077...  1854  003-2001
1855  0 days 15:32:30.010000  5595001  5596375  0.017611   7.092237  ...  0.000000     4.373367  [75, 150, 226, 0.9176870729126787, 0.846958319...  1855  003-2001

[1856 rows x 23 columns]
Main Functions fetching event time, ppg start time and the relative time
45 46 47 48 49 50 51 52 53 54 55 56 57 58 59 60 61 62 63 64 65 66 67 68 69 70 71 72 73 74 75 76 77 78 79 80 81 82 83 84 85 86 87 88 89 90 91 92 93 94 95 96 97 98 | '''
We might need to add another function input variable for ID, depending on how we structure
SQI Dataframes i.e. Single or Double
'''
#Function that fetches the time of a pre-specified event into a list for multiple occurences
def find_event_time(Clinical,SQIs,event):
indx_list = []
date_list = []
for i in range(len(Clinical['study_no'])):
#Need to revise this logic, doing this just to get a picture on how to do it
if Clinical['study_no'][i] == SQIs['study_no'][1] and (Clinical['column'][i] == event and Clinical['result'][i] == 'True' or Clinical['result'][i] == event):
indx_list.append(i)
date_list.append(Clinical['date'][i])
return indx_list, date_list
#Calcuating the time of ppg_start
def find_event_ppg_time(Clinical,SQIs):
for i in range(len(Clinical['study_no'])):
#first logical expression needs revisting for multiple SQI Dataframes, event_ppg seemed accurate when crosschecking with raw data
if Clinical['study_no'][i] == SQIs['study_no'][1] and Clinical['column'][i] == 'event_ppg' and Clinical['result'][i] == 'True':
ppg_start = Clinical['date'][i]
return ppg_start
#Calculating the relative time i.e. time of event - time of start
def calculate_relative_time(ppg_start, date_list):
relative_event = []
for i in range(len(date_list)):
if ppg_start < date_list[i]: #Makins sure that event is after start of PPG Record
temp_date_list = datetime.strptime(date_list[i], '%Y-%m-%d %H:%M:%S') #converting str to datetime
print('Temporary Date List (converted to datetime):')
print(temp_date_list)
temp_ppg_start = datetime.strptime(ppg_start, '%Y-%m-%d %H:%M:%S') #converting str to datetime
print('Temporary PPG Start (converted to datetime):')
print(temp_ppg_start)
relative_event.append(temp_date_list-temp_ppg_start) #List of events with relative times
return relative_event
#Defining the event we are interested in (this one was used as an example as it was the only one that could be used for this specified patient)
event_lookup = 'event_laboratory'
ppg_start = find_event_ppg_time(Clinical,SQIs)
print('PPG Start Time:')
print(ppg_start)
indx_list, date_list = find_event_time(Clinical, SQIs, event_lookup)
print('Event Indexes List:')
print(indx_list)
print('Event Datetime List:')
print(date_list)
relative_event = calculate_relative_time(ppg_start, date_list)
print('Relative Event List:')
print(relative_event)
|
Out:
PPG Start Time:
2020-06-04 09:05:00
Event Indexes List:
[24089, 24218, 24275]
Event Datetime List:
['2020-06-03 08:56:00', '2020-06-04 08:00:00', '2020-06-05 06:04:00']
Temporary Date List (converted to datetime):
2020-06-05 06:04:00
Temporary PPG Start (converted to datetime):
2020-06-04 09:05:00
Relative Event List:
[datetime.timedelta(seconds=75540)]
Using the relative time we can calculate the window and then match the event to the SQI window
105 106 107 108 109 110 111 112 113 114 | #The following was used during debugging
#SQIs = SQIs.drop(['Event'], axis = 1)
#We divide by 30 to find the number of windows, -10 for the 5 minute trimming and -1 for the indexing
Window_position = int((relative_event[0].seconds/30) - 10 - 1) #(due to the trimming and indexing of w starting from 0)
#The below is done for the sake of the example as we cannot find an event within the PPG record for this patient (other than Dengue Shock which has no time)
#And we are subtractinf 2513 to be able to easily observe the effect of the actions that follow
Window_position = Window_position - 2503
print(Window_position)
|
Out:
4
We then match the event to the specific window using indexing and the “w” column constructed earlier.
118 119 120 121 122 123 124 125 | if SQIs['w'][Window_position]:
SQIs['Event'] = np.nan #filling up with nans to form the column
SQIs['Event'][Window_position] = event_lookup #replacing the nan with the event on the specified cell
#The raise below is not really needed since if it is out of range another ValueError will be raised
else:
raise ValueError('Window not found') #just in case not such window exists
print(SQIs)
|
Out:
D:\FILES\Desktop\Dissertation ICL\Git\main\examples\Pre-processing\plot_SQI_and_clinical_matching.py:120: SettingWithCopyWarning:
A value is trying to be set on a copy of a slice from a DataFrame

See the caveats in the documentation: https://pandas.pydata.org/pandas-docs/stable/user_guide/indexing.html#returning-a-view-versus-a-copy
  SQIs['Event'][Window_position] = event_lookup #replacing the nan with the event on the specified cell
d:\files\desktop\dissertation icl\env\lib\site-packages\pandas\core\indexing.py:1637: SettingWithCopyWarning:
A value is trying to be set on a copy of a slice from a DataFrame

See the caveats in the documentation: https://pandas.pydata.org/pandas-docs/stable/user_guide/indexing.html#returning-a-view-versus-a-copy
  self._setitem_single_block(indexer, value, name)
                   timedelta    first     last    skew_0  ...                                      correlogram_1     w  study_no             Event
0     0 days 00:05:00.010000    30001    33000  0.011563  ...  [75, 150, 225, 0.9087943183455219, 0.789911832...     0  003-2001               NaN
1     0 days 00:05:30.010000    33001    36000 -0.132401  ...  [74, 148, 222, 0.9181757635079706, 0.827234373...     1  003-2001               NaN
2     0 days 00:06:00.010000    36001    39000 -0.124814  ...  [75, 150, 224, 0.9094662436276878, 0.775536874...     2  003-2001               NaN
3     0 days 00:06:30.010000    39001    42000  0.087626  ...  [75, 150, 225, 0.9134459565030647, 0.822742844...     3  003-2001               NaN
4     0 days 00:07:00.010000    42001    45000 -0.058097  ...  [74, 149, 223, 0.913985197557938, 0.7969092381...     4  003-2001  event_laboratory
...                      ...      ...      ...       ...  ...                                                ...   ...       ...               ...
1851  0 days 15:30:30.010000  5583001  5586000  0.144338  ...  [31, 74, 105, -0.38335045092285824, 0.93538125...  1851  003-2001               NaN
1852  0 days 15:31:00.010000  5586001  5589000  0.128500  ...  [76, 151, 226, 0.9362344077635872, 0.847005080...  1852  003-2001               NaN
1853  0 days 15:31:30.010000  5589001  5592000 -0.003407  ...  [76, 152, 228, 0.9537593069974436, 0.889395196...  1853  003-2001               NaN
1854  0 days 15:32:00.010000  5592001  5595000  0.113608  ...  [74, 149, 223, 0.9298975484283258, 0.810992077...  1854  003-2001               NaN
1855  0 days 15:32:30.010000  5595001  5596375  0.017611  ...  [75, 150, 226, 0.9176870729126787, 0.846958319...  1855  003-2001               NaN

[1856 rows x 24 columns]
Save to CSV File
130 | SQIs.to_csv(r'..\..\..\..\OUCRU\01NVa_Dengue\Adults\01NVa-003-2001\SQI_and_clinicals.csv')
|
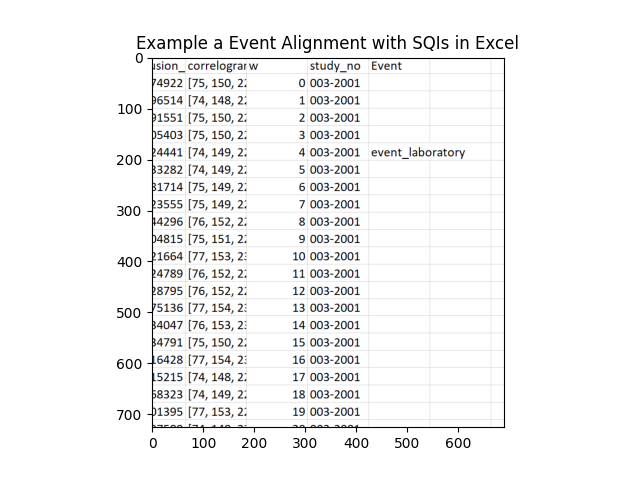
Allignment Example
135 136 137 | img = plt.imread(r'..\..\..\..\MISC\SQI_Clinical_Image_example.png')
plt.title('Example a Event Alignment with SQIs in Excel')
plt.imshow(img)
|
Out:
<matplotlib.image.AxesImage object at 0x000001B3C5F8CAC0>
Some thoughts on a single file SQIs (Ignore for now)
140 141 142 143 144 145 146 | '''
ID = [SQIs['study_no'][0]]
for i in range(len(SQIs['study_no']-1)):
if ID != ID[-1]:
ID = ID.append(SQIs['study_no'][i+1])
find_time(Clinical_df, SQIs, 'event_shock', ID)
'''
|
Out:
"\nID = [SQIs['study_no'][0]]\nfor i in range(len(SQIs['study_no']-1)):\n if ID != ID[-1]:\n ID = ID.append(SQIs['study_no'][i+1])\n find_time(Clinical_df, SQIs, 'event_shock', ID)\n"
Total running time of the script: ( 0 minutes 1.123 seconds)