Note
Click here to download the full example code
PPG Pre-processing and SQI Calculations
Trimming, Filtering, Segmentation and SQI Calculations
9 10 11 12 | # Code Adapted from:
# https://github.com/meta00/vital_sqi/blob/main/examples/SQI_pipeline_PPG.ipynb
# AND
# https://meta00.github.io/vital_sqi/_examples/others/plot_read_signal.html#sphx-glr-examples-others-plot-read-signal-py
|
Libraries
17 18 19 20 21 22 23 24 25 26 27 28 29 30 31 | # Generic
import os
import numpy as np
import pandas as pd
import matplotlib.pyplot as plt
# Scipy
from scipy.stats import skew
from scipy.stats import kurtosis
# vitalSQI
from vital_sqi.data.signal_io import PPG_reader
import vital_sqi.highlevel_functions.highlevel as sqi_hl
import vital_sqi.data.segment_split as sqi_sg
from vital_sqi.common.rpeak_detection import PeakDetector
|
Out:
Importing the dtw module. When using in academic works please cite:
  T. Giorgino. Computing and Visualizing Dynamic Time Warping Alignments in R: The dtw Package.
  J. Stat. Soft., doi:10.18637/jss.v031.i07.
Load data
37 38 39 40 41 42 43 44 45 46 47 48 49 50 51 52 53 54 55 56 57 58 59 60 61 62 63 64 65 66 67 68 | # Filepath
filepath = r'..\..\..\..\OUCRU\01NVa_Dengue\Adults\01NVa-003-2001\PPG'
filename = r'01NVa-003-2001 Smartcare.csv'
#defining constants
trim_amount = 120
hp_filt_params = (1, 1) #(Hz, order)
lp_filt_params = (20, 4) #(Hz, order)
filter_type = 'butter'
segment_length = 30
sampling_rate = 100
#readind PPG data
data = PPG_reader(os.path.join(filepath, filename),
signal_idx=["PLETH", "IR_ADC"],
timestamp_idx=["TIMESTAMP_MS"],
info_idx=["SPO2_PCT","PULSE_BPM","PERFUSION_INDEX"], sampling_rate=sampling_rate)
print(data)
print(data.signals)
print(data.sampling_rate)
print(data.start_datetime)
print(data.wave_type)
print(data.signals.shape)
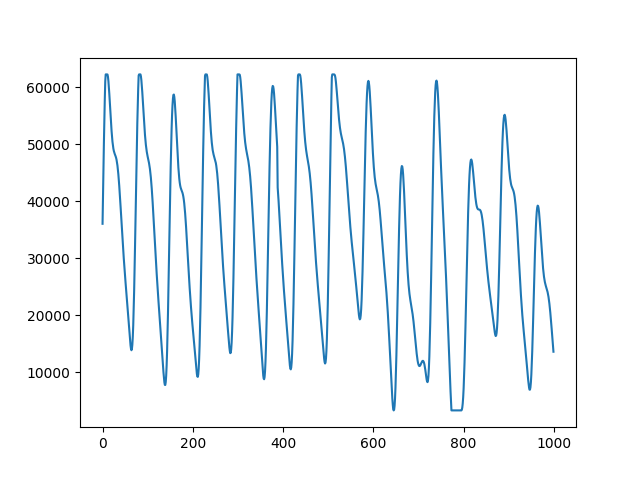
plot_range = np.arange(0,1000,1)
fig, ax = plt.subplots()
ax.plot(plot_range, data.signals[0][0:1000])
|
Out:
<vital_sqi.data.signal_sqi_class.SignalSQI object at 0x000001AC953D1670>
[[ 36033  40919  45715 ...  31117  30761  30261]
 [216524 216470 216415 ... 184296 184554 184828]]
100
None
ppg
(2, 5626377)

[<matplotlib.lines.Line2D object at 0x000001AC96431BB0>]
Filtering, Trimming and Segmentation
75 76 77 78 79 80 81 82 83 84 85 86 87 88 89 90 91 92 93 94 95 96 | #Saving a copy of the original Sigal
original_signal = np.copy(data.signals.T[trim_amount*sampling_rate:-trim_amount*sampling_rate].T)
original = pd.DataFrame(original_signal)
print("Raw Signals Shape: ", original.shape)
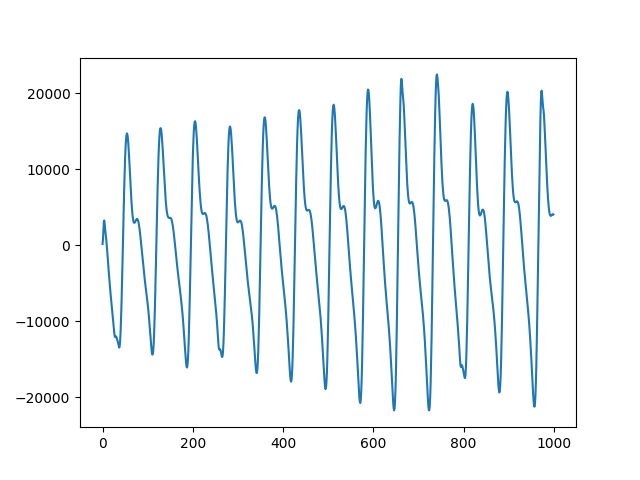
#Signal Filtering
data.update_signal(sqi_hl.signal_preprocess(signal_channel=data.signals, hp_cutoff_order=hp_filt_params, lp_cutoff_order=lp_filt_params, trim_amount=trim_amount, filter_type=filter_type, sampling_rate=sampling_rate))
signals = pd.DataFrame(data.signals)
print("Filtered Signals Shape: ", signals.shape)
fig, ax = plt.subplots()
ax.plot(plot_range, data.signals[0][0:1000])
# Signal Segmenation
data.update_segment_indices(sqi_sg.generate_segment_idx(segment_length=segment_length, sampling_rate=sampling_rate, signal_array=data.signals))
print("Data Segments Shape: ", data.segments.shape)
segments= pd.DataFrame(data.segments)
|
Out:
Raw Signals Shape:  (2, 5602377)
Filtered Signals Shape:  (2, 5602377)
Data Segments Shape:  (2, 1868)
Peak Detection
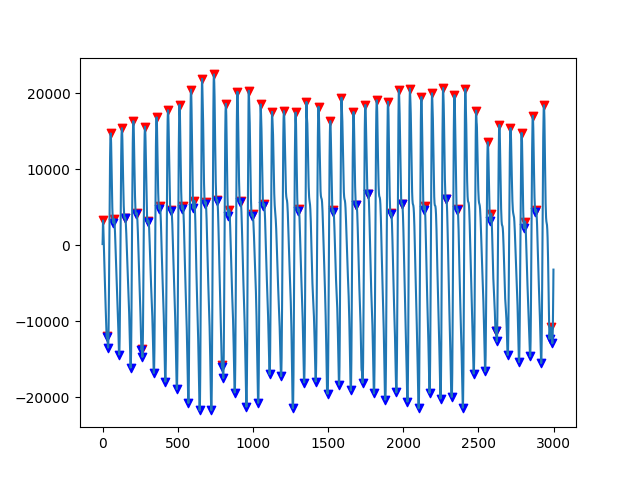
102 103 104 105 106 107 108 109 110 111 112 113 114 115 116 117 118 119 120 121 122 123 124 125 | #Peak Detector
peak_list, trough_list = PeakDetector().ppg_detector(signals.iloc[0,segments.iloc[0,0]:segments.iloc[0,1]], 7)
plot_range = np.arange(0,3000,1)
fig, ax = plt.subplots()
ax.plot(plot_range, signals.iloc[0, segments.iloc[0,0]:segments.iloc[0,1]])
if len(peak_list)!=0:
ax.scatter(peak_list,signals.iloc[0,peak_list],color="r",marker="v")
if len(trough_list)!=0:
ax.scatter(trough_list,signals.iloc[0,trough_list],color="b",marker="v")
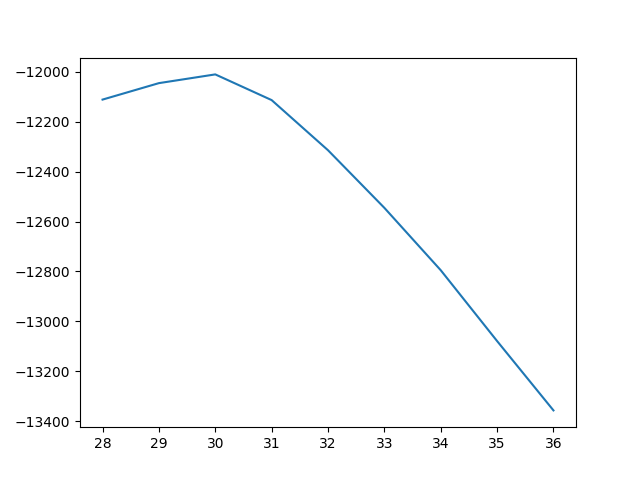
#Single period plot
fig, ax = plt.subplots()
ax.plot(signals.iloc[0,trough_list[0]:trough_list[1]])
print(data.signals[0])
print(data.signals.shape)
print(segments.shape)
print(data.segments.shape)
print(original_signal.shape)
print(peak_list.shape)
print(trough_list.shape)
|
Out:
[ 142  821 2090 ... 1555 1462 1302]
(2, 5602377)
(2, 1868)
(2, 1868)
(2, 5602377)
(71,)
(71,)
SQI Calculation
133 134 135 136 137 138 139 140 141 142 143 144 145 146 147 148 149 150 151 152 153 154 155 156 157 | #THE FUNCTION BELOW OUTPUTS AN ERROR, NEEDS TO BE EDITED SO THAT if signals are none, they are replaced with NaN
#computed_sqi = sqi_hl.compute_all_SQI(signal=data.signals[0], segments=data.segments[0], raw_signal=original_signal[0], primary_peakdet=7, secondary_peakdet=6, template_type=0)
'''
ERROR THAT COMES UP:
raise Exception("Not enough peaks in the signal to generate per beat SQI")
Exception: Not enough peaks in the signal to generate per beat
THIS COMES UP FOR PLETH (index 0) BUT NOT FOR IR_ADC (index 1)
'''
'''
computed_sqi = pd.DataFrame(computed_sqi)
print(computed_sqi[2].keys())
print(data.segments.shape)
print(peak_list.shape)
print(trough_list.shape)
print(computed_sqi[1873]['snr'])
'''
|
Out:
"\ncomputed_sqi = pd.DataFrame(computed_sqi)\n\n\nprint(computed_sqi[2].keys())\nprint(data.segments.shape)\nprint(peak_list.shape)\nprint(trough_list.shape)\nprint(computed_sqi[1873]['snr'])\n"
Segment Rejection
163 164 165 166 167 168 169 170 171 172 173 174 175 176 | #AFTER COMPUTING SQIs REJECT USING CRITERIA IS THE NEXT STEP.
plt.show()
|
Total running time of the script: ( 0 minutes 12.882 seconds)